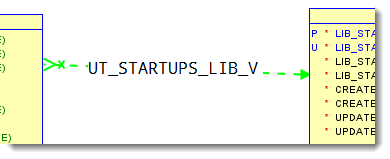
The end goal for many users of Oracle SQL Developer Data Modeler is a a nicely formatted, easy to read diagram. Diagrams are composed of two primary components:
- Tables or Entities
- Relationships
Today’s post is all about how to manage the display of the relationships.
How can I move the lines around?
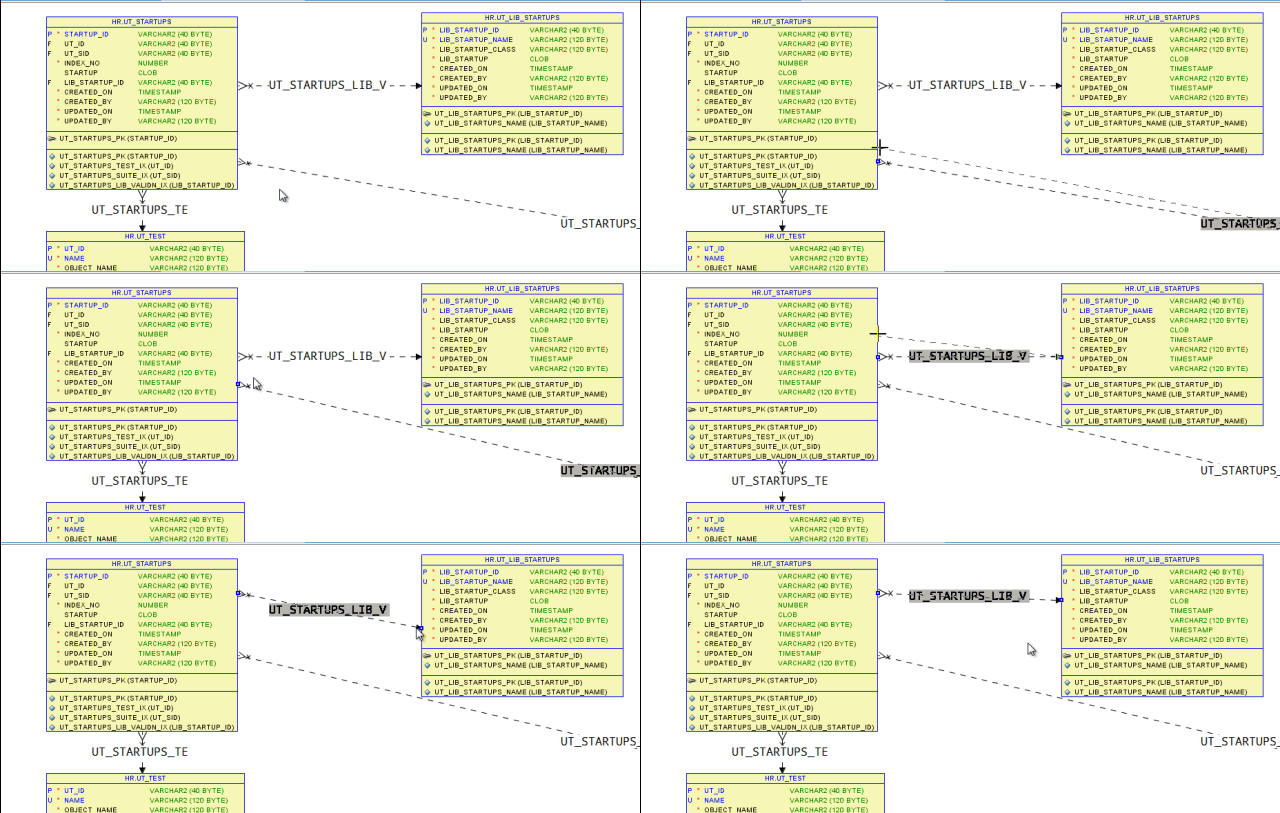
You might not like the default anchor point positions of the relationship lines. You can easily move these, but there’s a slight ‘trick.’ Believe it or not, I have seen several modeling tools where this is nigh impossible.
Select the relationship. Move your cursor over the anchor point. When the cursor switches to ‘cross-hairs’ mode, then you can drag the anchor point to your new location. Maybe a video would help?
How can I display the relationship names in the diagram?
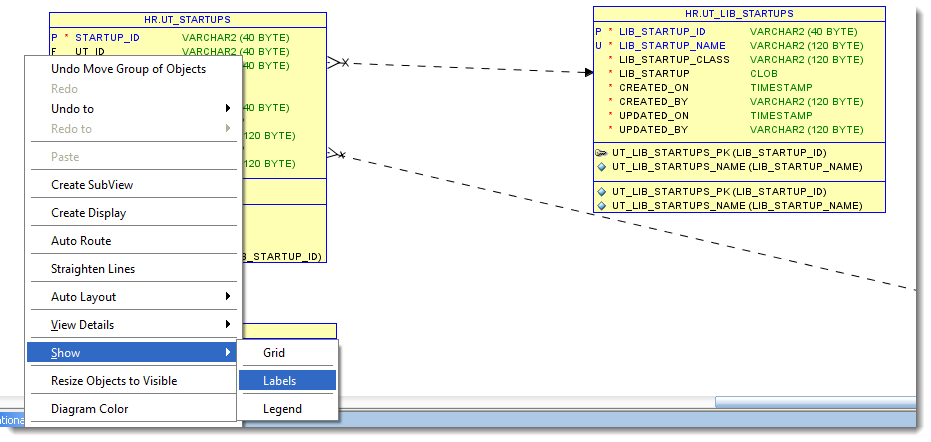
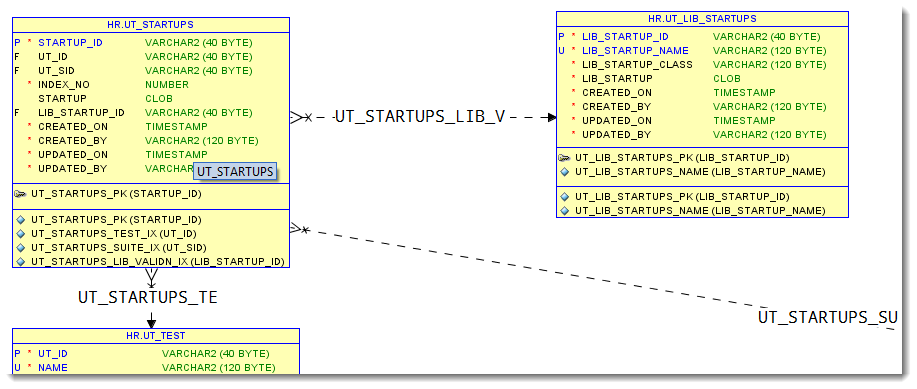
It’s a ‘Show’ option. The relationship names are referred to as ‘labels’ in SQL Developer. So right click in the model, go to ‘Show’ and toggle on ‘Labels.’
Default, No Labels
With Labels
How do I change the Font and Color of the Labels and Lines
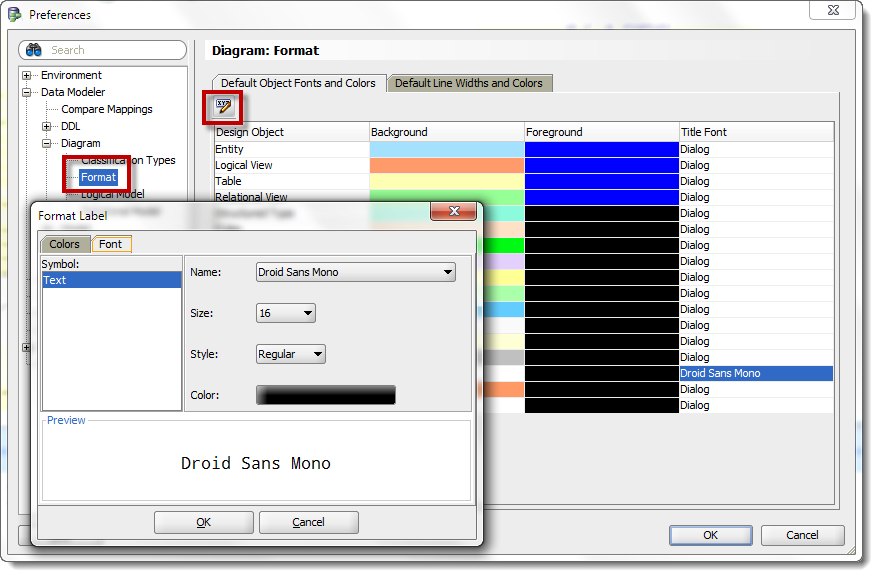
The default font face and color for the labels and the line width and colors for relationships are configured in the preferences.
So very quickly I can make something very, very ugly.
You can manually override the display format of any relationship. Just right-click on the line and select ‘Format.’ You can then change the line width and/or color. If you right-click on the label, you can do the same ‘Format’ and change the text color and font settings.
