A request from Leslie today to help her out on the user docs. In them we state that we support the MSWord organization charts but we do not give any detail.
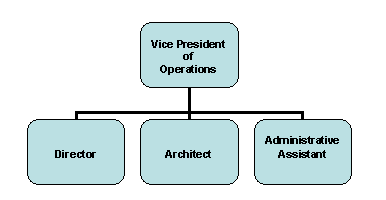
Use the organization chart functionality in the templates and the chart that is rendered in the output. Figure 4-18 shows an example of an organization chart.Figure 4-18 Sample Organization Chart

Its been a while since I have looked at them but we mean just that. You build an org chart with names in the boxes, BIP will render it, simple.
Oh, you wanted it to load the names into the chart dynamically from the dataset? Sorry, no dice, at least not with the MSWord Org Chart object.
However, you can create your own org chart structure using MSShapes and use BIP's ability to fill those shapes with text from your data. Thats documented pretty well and is very easy to do. Taking it to obvious final step; completely data driven org chart structure and text. Thats a bit tougher. It can be done with the shape copy and move commands but its going to take some planning. You need to think about how wide your 'page' is, what to do when you reach the edge and need to continue with the same level in the hierarchy, etc.
To get you started, I have created a sample template and data for the first two scenarios. They will work with all releases of BIP and XMLP. The third will take me a little longer :0)